
Continuous Time Studies: Are Your Engineered Standards Still Accurate?

Continuous Time Studies: Are Your Engineered Standards Still Accurate?
How much engineering time does your plant spend measuring work instead of improving it?
Industrial engineers rely on time studies to establish labor standards, identify bottlenecks, balance production lines, and determine how much capacity an operation actually has.
But conducting those studies takes time. An engineer may spend hours observing a single workstation, recording cycle times, categorizing activities, and analyzing the results. Multiply that effort across dozens of workstations, and maintaining accurate production standards becomes a significant engineering responsibility.
There’s another problem: production processes don’t remain static after a time study is completed.
Product mix changes. Operators develop new methods. Material locations shift. Equipment wears down. Small inefficiencies accumulate, often without being reflected in the original engineered standards.
Continuous time studies, enabled by visual intelligence, offer a different approach.
By using cameras and AI to continuously measure production activities, manufacturers can establish ongoing performance baselines rather than relying exclusively on periodic observations.
The objective isn’t to eliminate industrial engineering time studies. It’s to reduce the effort required to collect routine measurements, identify when standards no longer reflect reality, and direct engineering attention toward the processes that need it most.
Key Takeaways: Continuous Time Studies in Manufacturing
- Traditional time studies provide valuable production measurements but require significant engineering time to conduct and maintain.
- Engineered labor standards can become outdated as staffing, product mix, equipment, and production methods change.
- Visual intelligence enables continuous measurement of cycle times, value-added activities, waiting, and other non-value-added work.
- Continuous baselines help engineers identify process changes, investigate performance variation, and prioritize improvement opportunities.
- More accurate production measurements can support line balancing, labor planning, capacity analysis, and production scheduling.
What Is a Continuous Time Study?
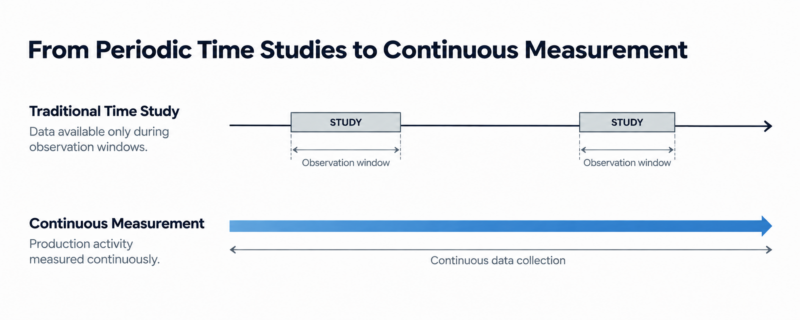
A continuous time study is the ongoing measurement of production activities, cycle times, and process performance over extended periods.
Traditional stopwatch time studies typically measure a defined sample of work cycles. Engineers observe a process, record the time required to complete individual activities, and use those observations to establish a baseline or engineered standard.
Continuous time studies extend this measurement process across days, weeks, or months.
Using visual intelligence, manufacturers can analyze camera footage to identify production activities and measure how time is spent at individual workstations.
Depending on the process and configured activity recognition, measurements may include:
- Cycle time: The time required to complete a production cycle.
- Value-added time: Time spent performing activities that directly contribute to producing the product.
- Non-value-added time: Time spent waiting, walking, searching for materials, or performing other activities that do not directly add value.
- Operator presence and staffing: The number of people working at a station and when they are present.
- Process variability: Differences in cycle times and activity durations across production periods.
- Station utilization: The proportion of available time a workstation is actively engaged in the measured process.
Rather than producing a single snapshot, continuous measurement creates a historical record of how a process actually operates.
This makes it possible to compare current performance against previous periods, identify emerging changes, and determine where additional engineering investigation is warranted.
Why Traditional Manufacturing Time Studies Have Limitations
Traditional time studies remain a fundamental industrial engineering tool.
They provide detailed observations, help establish standard work, and support labor and capacity calculations.
However, three limitations become increasingly important when manufacturers attempt to maintain accurate measurements across large production operations.
1. Time Studies Require Engineering Resources
Consider a manufacturing facility with 50 workstations.
If an engineer spends three hours observing, documenting, and analyzing each workstation, the initial study requires 150 engineering hours.
That represents nearly four full-time workweeks of effort before accounting for travel between departments, interruptions, reporting, or follow-up investigations.
And those measurements will eventually need to be revisited.
For facilities with hundreds of workstations, the effort required to maintain accurate process baselines can become substantial.
Continuous visual measurement can reduce the amount of repeated manual data collection needed after the initial system setup.
Engineers still need to define the activities being measured, validate the results, and interpret the findings. But routine collection of cycle and activity data can occur without requiring an engineer to observe every production cycle.
2. Short Observation Periods May Miss Normal Production Variation
Manufacturing performance varies throughout the day and across different operating conditions.
An operator may complete a process efficiently during a two-hour observation but experience material shortages later in the shift.
A workstation may perform differently depending on product configuration, staffing, or the experience of the assigned operator.
Changeovers, equipment interruptions, and material replenishment activities may not occur during the observation window.
Consequently, a time study conducted over a limited period may not capture the full range of operating conditions.
Continuous measurement provides a larger sample of production activity, making it easier to distinguish typical performance from unusual events.
3. Engineered Standards Can Become Outdated
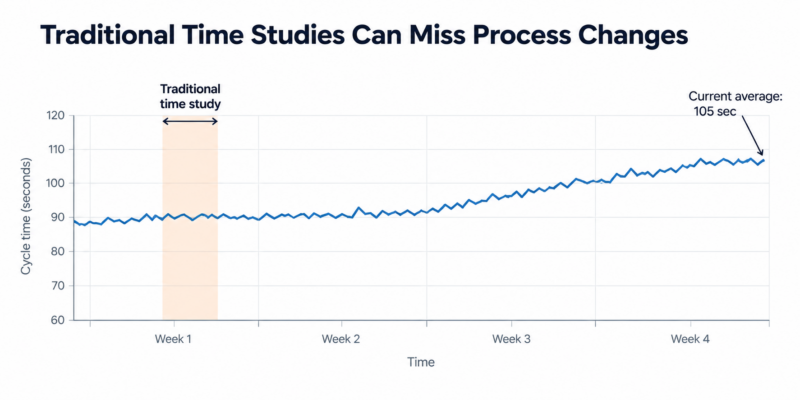
A standard established six months ago may no longer represent the current production process.
Consider a workstation where an industrial engineer originally measured an average observed cycle time of 90 seconds.
Since that study, the facility has introduced a new product variant, relocated material storage, and changed the workstation layout.
The actual average cycle time may now be 105 seconds.
Without another study, the difference could remain unnoticed or be attributed to operator performance rather than changes in the process itself.
Continuous baselining makes these differences visible.
From Periodic Time Studies to Continuous Production Baselines
Consider a manufacturer operating four assembly workstations.
The industrial engineering team established cycle-time baselines several months ago, but management has recently noticed that production output is becoming less predictable.
A continuous visual measurement system begins collecting activity data across all four stations.
After several weeks, the following pattern emerges.
Illustrative example: not actual Leela AI customer data.
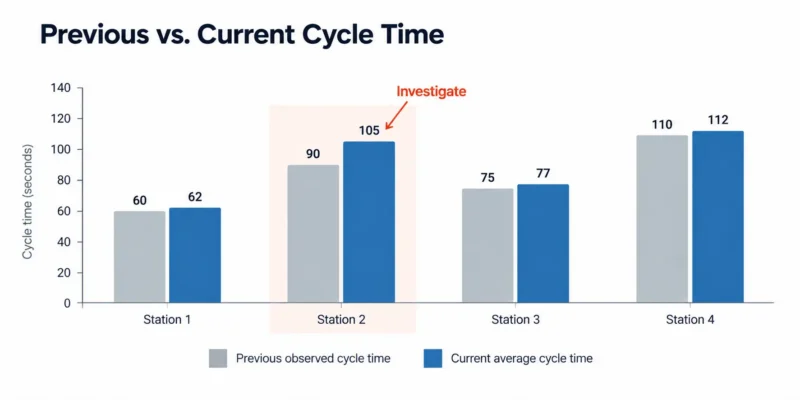
Workstation | Previous observed cycle time | Current average cycle time | Change |
Station 1 | 60 sec | 62 sec | +3.3% |
Station 2 | 90 sec | 105 sec | +16.7% |
Station 3 | 75 sec | 77 sec | +2.7% |
Station 4 | 110 sec | 112 sec | +1.8% |
Station 2 stands out.
While the other stations remain relatively close to their previous measurements, Station 2 has experienced a substantial increase in average cycle time.
An industrial engineer investigates the activity breakdown and discovers that operators are spending more time retrieving components from a material rack that was relocated during a previous layout change.
The issue isn’t necessarily operator speed or performance.
It’s a process change that increased non-value-added activity.
Instead of repeating detailed time studies across all four stations, the engineering team can focus its investigation on Station 2.
The result is a more targeted use of engineering resources.
Four Ways Continuous Time Studies Support Industrial Engineering
1. Reduce Time Spent Collecting Routine Production Data
One of the most immediate benefits of continuous measurement is reducing the need to repeatedly collect the same types of observations.
Traditional time studies require an engineer or technician to observe a process and record measurements.
With visual intelligence, configured activities can be measured automatically across production periods.
This allows engineers to spend more time on work such as process redesign, root-cause analysis, line balancing, ergonomic improvements, and automation feasibility studies.
The distinction matters.
The value isn’t simply collecting more data. It’s reducing the engineering effort required to obtain useful data.
Continuous measurement doesn’t eliminate the need for engineering judgment, but it can shift the engineer’s role from routine observation toward analysis and improvement.
2. Identify When Production Performance Changes
A time study tells engineers how a process performed during a particular observation period.
Continuous baselining makes it possible to track how that performance changes.
For example, a station may maintain a stable average cycle time for several weeks before gradually increasing.
That change could indicate equipment deterioration, additional handling requirements, changes in material presentation, or a new product configuration.
By comparing current activity measurements with historical performance, engineers can identify when and where the process changed.
This can also help determine whether a recent improvement actually produced the intended results.
If a workstation layout is redesigned to reduce walking time, continuous measurements can compare activity durations before and after implementation.
Rather than relying on a short follow-up study, the engineering team can examine whether the improvement persists over subsequent production periods.
3. Improve Line Balancing and Labor Allocation
Accurate cycle-time and activity measurements are essential for effective line balancing.
A production line may have several workstations with different labor requirements and utilization levels.
When engineers rely on outdated observations, staffing decisions may not reflect how work is currently distributed.
Continuous time studies provide updated information about actual cycle times, activity durations, and operator presence.
Consider a line where one station consistently operates near its available capacity while downstream stations spend significant time waiting.
This pattern may indicate a production constraint or an opportunity to redistribute work.
Engineers can investigate whether tasks should be reassigned, workstations redesigned, or staffing adjusted.
Importantly, a high-utilization station isn’t automatically the system bottleneck, and low utilization doesn’t automatically mean excess labor. Engineers still need to account for process dependencies, demand, and production flow.
Continuous measurement provides evidence to support those decisions rather than relying entirely on historical standards.
4. Support More Accurate Capacity Planning and Scheduling
Production planning depends on assumptions about how long work takes.
Those assumptions influence expected throughput, labor requirements, production schedules, and delivery commitments.
When actual process performance differs from the measurements used for planning, schedules can become unrealistic.
For example, a planner may assume a workstation completes a cycle every 90 seconds based on a previous study.
If the current process averages 105 seconds, the available production capacity is lower than that assumption suggests.
Continuous measurements can help identify these differences before they become recurring scheduling problems.
By analyzing observed cycle times across different operating conditions, manufacturers can develop more realistic capacity assumptions.
These measurements can also help identify whether production variability is driven by processing time, material availability, staffing, or other factors.
Continuous time studies do not replace scheduling systems or engineered labor standards. They provide additional evidence to help keep the underlying planning assumptions accurate.
Continuous Measurement Is Not the Same as an Engineered Labor Standard
There is an important distinction between measuring observed cycle time and establishing an engineered labor standard.
An engineered standard may account for the defined work method, expected performance, allowances, and other factors required by the organization’s work-measurement methodology.
A camera measuring an average cycle time does not automatically establish a valid standard time.
For example, observed cycle times may include abnormal delays, inconsistent work methods, or temporary operating conditions.
Those measurements still require interpretation.
Industrial engineers must determine which activities should be included, which conditions are representative, and how observed performance relates to the intended work method.
This is where continuous visual intelligence and traditional industrial engineering methods complement one another.
Visual intelligence can provide a large, continuously updated dataset.
Industrial engineers provide the process knowledge and judgment required to turn that dataset into useful standards and improvement decisions.
How to Implement Continuous Time Studies with Visual AI
Step 1: Select a Production Area
Start with a line or cell where reliable cycle-time and activity measurements would support a clear operational decision.
Good candidates include processes with high manual labor content, significant cycle-time variability, frequent line-balancing concerns, or outdated work-measurement data.
Step 2: Define the Activities to Measure
Identify the production activities relevant to the engineering question.
These might include assembly, inspection, material retrieval, waiting, walking, or changeover tasks.
The measurement plan should distinguish between productive activity and sources of non-value-added time.
Step 3: Establish a Continuous Baseline
Use the visual intelligence system to collect activity measurements over a representative production period.
Include relevant operating conditions, such as different shifts, product configurations, and staffing arrangements.
Validate the activity classifications and cycle measurements against known process observations before relying on the results.
Step 4: Compare Current Performance Against Previous Measurements
Review cycle-time distributions, activity breakdowns, and changes in workstation performance.
Identify stations where observed conditions differ materially from previous measurements or expected operating conditions.
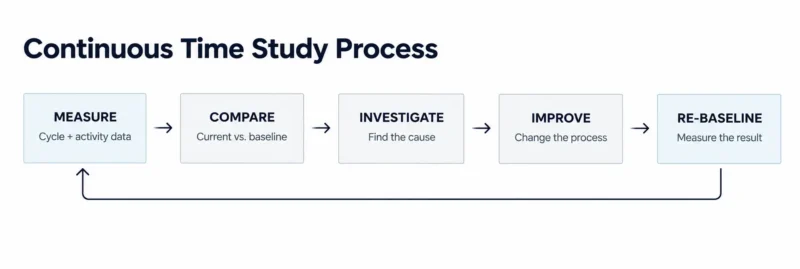
Step 5: Investigate, Improve, and Re-baseline
Use the continuous data to prioritize detailed engineering investigations.
Implement process improvements where appropriate, then compare subsequent performance against the previous baseline.
The goal is to establish an ongoing measurement-and-improvement process rather than a one-time study.
Common Pitfalls in Continuous Time Studies
Continuous measurement provides more observations, but more data doesn’t automatically mean better engineering decisions.
Confusing observed time with standard time is one common mistake. A continuous average is not automatically an engineered labor standard.
Ignoring product mix and operating conditions can also produce misleading comparisons. Cycle times should be interpreted in the context of the work being performed.
Focusing on individual operators instead of process performance can undermine improvement efforts. Measurements should help identify process constraints, material flow problems, and opportunities to improve the production system.
Finally, collecting data without acting on it limits the value of continuous measurement. Establishing a review process helps ensure that significant changes lead to engineering investigation and, where appropriate, corrective action.
Turning Time Studies Into a Continuous Improvement Tool
Traditional time studies remain essential to industrial engineering.
But the manufacturing processes they measure are constantly changing.
Relying exclusively on periodic observations can leave manufacturers working with outdated performance assumptions and require significant engineering effort to maintain accurate baselines.
Continuous visual intelligence provides another source of production measurement.
By tracking cycle times, activity durations, and process variation over extended periods, manufacturers can identify where performance has changed, where non-value-added time is accumulating, and where engineering resources should be directed.
The objective isn’t to replace the industrial engineer.
It’s to allow engineers to spend less time repeatedly measuring the same work and more time improving how that work gets done.
Measure continuously. Identify changes. Investigate the process. Improve. Re-baseline.
See How Your Production Processes Actually Perform
Leela AI uses visual intelligence and existing camera infrastructure to measure production activity across workstations, cells, and production lines.
By capturing cycle times, value-added activities, non-value-added time, and process variation, the Leela AI Visual Intelligence Platform helps manufacturing teams maintain continuous production baselines and identify opportunities for improvement.
Learn more about the Leela AI Visual Intelligence Platform →
FAQs About Continuous Time Studies
What is a continuous time study in manufacturing?
A continuous time study is the ongoing measurement of production activities and cycle times over extended periods. Unlike a traditional time study conducted during a limited observation window, continuous measurement can capture process performance across shifts, days, and changing production conditions.
Can visual AI replace traditional time studies?
Visual AI can automate portions of activity measurement and reduce repeated manual data collection. However, engineered labor standards still require appropriate work-measurement methods, validation, and industrial engineering judgment.
How can continuous time studies save engineering time?
Continuous measurement reduces the need to repeatedly observe and record routine production cycles. Engineers can use the resulting data to identify which workstations require detailed investigation, allowing them to concentrate more effort on analysis and process improvement.
Can continuous time studies improve production scheduling?
Yes. Observed cycle times and production activity data can help identify when actual performance differs from planning assumptions. This information can support more accurate capacity estimates, staffing decisions, and production schedules.
How do continuous time studies support continuous improvement?
Continuous time studies establish a baseline that can be compared against future production performance. Engineers can use these comparisons to identify emerging inefficiencies, evaluate process changes, and verify whether improvements are sustained over time.