
The Complete Guide to Shift Benchmarking with Visual AI

Background:
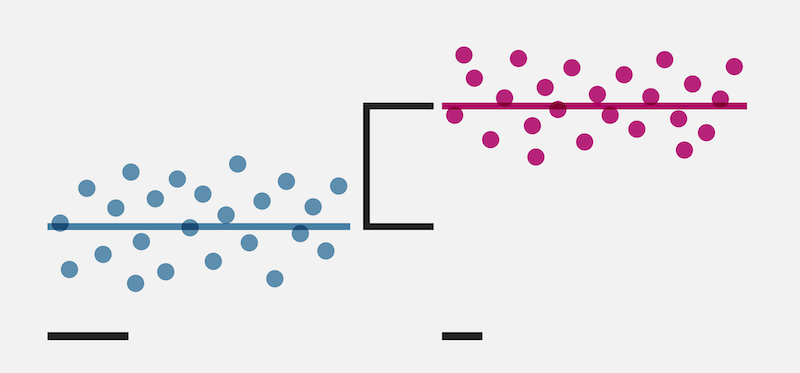
The first step in augmenting your operations using a visual IoT solution is to leverage your existing cameras. The second step is to baseline critical parts of your operation that are currently not instrumented. This whitepaper explains ai-assisted shift benchmarking, one of the most beneficial ways you can use visual intelligence.
Baseling leads to Boosting
Comparing shift performance on a production floor has never been straightforward. IIoT sensors tell you a machine ran, but they can’t tell you whether Shift A’s operators waited 20 minutes for parts that Shift B had pre-staged. MES data entry gets skipped or entered inconsistently, and periodic time studies capture only a small slice of what actually happens. Visual intelligence in manufacturing changes this equation by turning standard cameras into ongoing data feeds that measure cycle times, throughput, and non-value-added activities across every shift. This guide walks you through the fundamentals of shift benchmarking with visual AI, including what to measure, how to act on the data, and a concrete example of the process in action.
Key Takeaways: Shift Benchmarking with Visual AI
- Shift benchmarking (or baselining) compares cycle times, throughput, and value-added ratios across shifts to pinpoint best practices and performance gaps.
- Traditional data collection methods miss the human activities between machines, creating blind spots in shift-to-shift analysis.
- Visual intelligence platforms capture every workstation’s activity without manual data entry, observer bias, or workflow disruption.
- Leela AI delivers shift benchmarking analytics in one to three weeks, with AI training completed using just 3 to 10 video clips per station.
- Acting on benchmarking data requires collaboration between operations leaders and improvement teams, not dashboards alone.

What Is Shift Benchmarking in Manufacturing?
Shift benchmarking is the practice of comparing operational metrics (cycle time, throughput, value-added versus non-value-added time, staffing levels) between different shifts on the same production line. The goal is to identify why one shift consistently outperforms another and replicate what works.
This differs from general OEE tracking because it isolates human and process variables. Two shifts using the same equipment and raw materials can produce dramatically different results. Benchmarking at the shift level reveals the root causes: differences in tool staging, handoff routines, break scheduling, or how teams handle changeovers.
Why Traditional Methods Fall Short for Shift Comparison
MES platforms require team members to scan barcodes or enter codes at each step, but according to a Deloitte survey of 600 manufacturing executives, these inputs are often skipped or performed incorrectly. The data you get is incomplete, and incomplete data produces misleading comparisons.
Traditional time and motion studies capture a snapshot, typically a few days of observation. Shift-to-shift differences often emerge over weeks as teams develop different habits. A consultant or industrial engineer watching Shift B for two days may see their best behavior, not their typical behavior. IIoT sensors track machine uptime and cycle counts but miss the human activities that separate a strong shift from an average one.
How Visual Intelligence Enables Accurate Shift Benchmarking
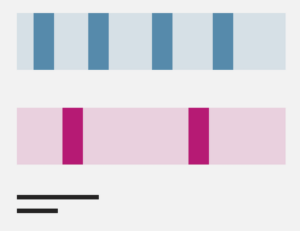
Visual intelligence platforms use cameras and AI to recognize, measure, and categorize production floor activities. The system distinguishes between value-added work (such as assembling a component) and non-value-added activities (such as searching for parts or waiting for materials). This data is collected across every shift, every day, without anyone needing to enter a code or click a button.
By tracking activities over extended periods, these platforms capture the variation that short observations miss. You can compare Shift A’s average cycle time at Station 5 against Shift B’s average over the same two-week period, broken down by value-added time, walking time, and wait time. The comparison is statistically meaningful because the data covers hundreds of cycles, not a handful of stopwatch readings.
What Metrics to Track for Shift-to-Shift Benchmarking
Focus on metrics that reveal actionable differences between shifts. Cycle time alone isn’t enough because two shifts can have similar cycle times but very different breakdowns of how that time is spent.
Track value-added time (actual assembly or processing work), non-value-added time (searching, waiting, walking), throughput per operator hour, and staffing levels per station including departures. Comparing these across shifts exposes whether the gap comes from process execution, team size, material staging, or some other variable. The Leela AI Visual Intelligence Platform makes this comparison straightforward through its Leela Viewer dashboard, which displays side-by-side shift metrics for cycle time, throughput, and value-added percentages.
A Concrete Example: Solving a Shift Performance Gap
The Problem
Consider a mid-size manufacturer running two shifts on the same assembly line. Shift 1 consistently produces 15% more units per day than Shift 2, but no one can pinpoint why. Both shifts have similar headcounts and use the same equipment. The plant manager suspects differences in operator experience, but periodic time studies haven’t confirmed that hypothesis because the studies were too brief and Shift 2’s team adjusted their behavior during observation.
The Solution
The operations leader and a CI (continuous improvement/kaizen) manager deploy visual intelligence cameras at all six workstations along the assembly line. Leela AI trains its activity recognition models using 3 to 10 hours of initial video collected per station, completing AI setup in under two weeks. Face and body blurring are active from day one, and the plant leadership walks the floor to explain the system’s purpose before the cameras are installed: it’s about process improvement, not individual performance monitoring.
After three weeks of data collection, the shift comparison dashboard reveals a clear pattern. Shift 2’s operators spend 22% of their time on non-value-added activities compared to Shift 1’s 14%. The gap traces to two root causes. First, Shift 2’s material staging process requires operators to walk to a central supply area instead of using point-of-use staging like Shift 1. Second, Shift 2 loses an average of 12 minutes per changeover because their handoff documentation from the prior shift is incomplete.
The Impact
The operations leader and CI manager implement two changes. They replicate Shift 1’s point-of-use material staging for Shift 2, cutting walking time by 8 minutes per cycle. They also create a standardized handoff checklist, captured from Shift 1’s best practices, that reduces changeover gaps by 9 minutes.
Four weeks after the changes, the visual intelligence data confirms that Shift 2’s non-value-added time dropped from 22% to 16%. Throughput improved by 11%, closing most of the gap. The CI manager now uses the ongoing data to monitor whether the gains hold and to identify the next round of improvements.
Who Is Involved
This type of initiative typically involves two key roles. The operations leader (plant manager, VP of Operations, or production director) owns the business case, approves the pilot, and acts on the results. The CI leader (lean lead, kaizen manager, or industrial engineer) designs the measurement plan, interprets the data, and leads the frontline through process changes.
Both roles need decision-ready information that connects specific activities to specific outcomes. Visual intelligence makes that connection by showing what actually happens at each station, for each shift, over time. Without that data, improvement conversations stay theoretical.

How to Start Shift Benchmarking with Visual AI
Step 1: Define What You Want to Compare
Start with a specific question. “Why does Shift A produce more than Shift B?” is better than “improve productivity.” The more focused your question, the more useful the benchmarking data becomes. Tie the question to a business outcome: reduced overtime, higher throughput, or more predictable delivery times.
Step 2: Select a Pilot Area
Choose a production line or cell where shift performance differences are known but unexplained. Areas with known bottlenecks are good candidates because improvements will be visible and measurable. The Leela AI Visual Intelligence Platform lets you start with a single camera and expand from there, so you don’t need to instrument an entire facility on day one.
Step 3: Engage Your Frontline Team
Frontline concerns about cameras in the workplace can derail implementations that otherwise make technical sense. Address privacy upfront by showing that facial blurring is active and explaining that the system tracks process flow, not individual performance. Involve team members in reviewing the data so they see it as a tool for improvement rather than oversight.
Step 4: Collect, Compare, and Act
Let the system gather data for at least two to three weeks before drawing conclusions. Short collection periods can reflect temporary variation rather than structural differences. Once you have enough data, compare the metrics shift by shift, identify the root causes of performance gaps, and implement targeted changes. Then measure again to confirm the impact.
Common Pitfalls in Shift Benchmarking
Blaming the crew instead of the process is the most frequent mistake. Shift benchmarking should reveal process, material, and staging differences, not label one team as “better” or “worse.” If the data shows a gap, ask what the higher-performing shift does differently at a process level and make that practice available to all shifts.
Another common issue is collecting data without acting on it. Analytics only create value when they drive operational changes. Establish a regular review cadence (weekly is a good starting point) where operations leaders and CI teams discuss the latest benchmarking data and assign action items.
In Conclusion: Shift Benchmarking Turns Production Data into Operational Gains
Manufacturing operations leaders face a visibility gap between what machines report and what actually happens during each shift. Visual intelligence closes that gap by capturing the human activities, process variations, and staging differences that explain why one shift outperforms another.
Leela AI gives you the ongoing, shift-by-shift data that makes benchmarking actionable, with privacy-first protections and rapid deployment that gets you to decision-ready information in weeks. If you can see the difference between your shifts, you can close it.
FAQs about Shift Benchmarking with Visual AI
What is shift benchmarking in manufacturing?
Shift benchmarking compares operational metrics like cycle time, throughput, and value-added ratios between different shifts on the same line. The goal is to identify process-level differences that explain performance gaps and standardize the approaches that produce better results.
How does visual intelligence improve shift-to-shift comparison?
Visual intelligence platforms capture production floor activities automatically and across every shift, removing the gaps created by manual data entry and periodic observations. Leela AI’s activity recognition measures value-added and non-value-added time at each station, giving you a statistically meaningful comparison over weeks rather than a brief snapshot.
What roles are most involved in shift benchmarking?
Operations leaders (plant managers, VPs of Operations) and CI leaders (lean leads, kaizen managers, industrial engineers) are the primary roles. Operations leaders own the business case and approve actions. CI leaders design the measurement plan and lead process changes on the floor.
How quickly can you get shift benchmarking data from a visual AI platform?
Leela AI sets up in days, with AI training completed in as little as a week using 3 to 10 video clips per station. Meaningful shift comparison data typically takes two to three weeks of collection. That makes it possible to go from installation to actionable insights in under a month.
Can shift benchmarking data integrate with existing MES or ERP systems?
Yes. Leela AI’s Visual Intelligence Platform integrates via API with MES, ERP, and IIoT systems. This lets you correlate visual intelligence shift data with machine metrics, production schedules, and quality records for a more complete picture of what drives shift-to-shift differences.