
Melt Shop · Zone & PPE Safety Dashboard
| Zone | Operators monitored | Zone intrusions | PPE violations | Open incidents |
|---|---|---|---|---|
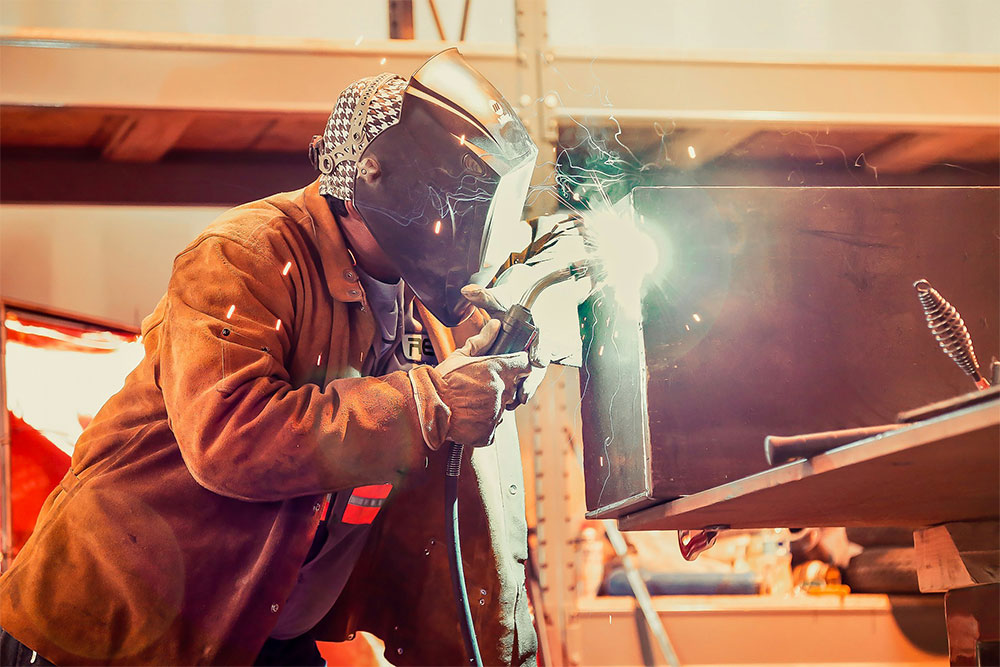
| Zone A · Ore Yard | 5 | 0 | 0 | 0 |
| Zone B · Furnace Charging | 6 | 1 | 0 | 0 |
| Zone C · Ladle Bay | 4 | 2 | 1 | 2 |
| Zone D · Casting & Pour Floor | 4 | 1 | 1 | 0 |
Are we seeing more no-go zone intrusions lately, and is PPE compliance part of the problem?
No-go zone intrusions have dropped from 12 to 4 per week over the last 6 weeks as barrier upgrades and refresher training have ramped up. Zone C — the ladle bay — remains the exception, accounting for 2 of this week's 4 intrusions — 1 of them also missing required PPE at the moment of entry, which is the combination we flag as highest severity.
All zones · last 6 weeks
Flagged clips like this one are automatically added to a shared safety review queue. Supervisors use it for same-day coaching, and Safety reuses it for zone-access refresher training — so each intrusion becomes a teaching moment instead of a one-off write-up.
Added to this week's safety review queue · tap to replay
Transformer Assembly Line · Station Cycle Time & Scheduler Dashboard
| Station | Record | Avg Actual | Deviation |
|---|---|---|---|
| Station 1 | 1h 00m | 0h 48m | −20% |
| Station 2 | 0h 48m | 1h 18m | +63% |
| Station 3 | 1h 30m | 0h 54m | −40% |
| Station 4 | 1h 06m | 0h 43m | −35% |
Hours:minutes per unit, by station
The line scheduler paces new jobs off each station's trailing 3-month average actual cycle time — not the original cycle-time-of-record — so the schedule reflects how the line really runs, including Station 2 running well over its cycle time of record.
| Station | Avg Actual | Deviation | Scheduled Takt |
|---|---|---|---|
| Station 1 | 0h 48m | −20% | 1h 00m |
| Station 2 | 1h 18m | +30% | 1h 00m |
| Station 3 | 0h 54m | −10% | 1h 00m |
| Station 4 | 0h 43m | −35% | 0h 45m |
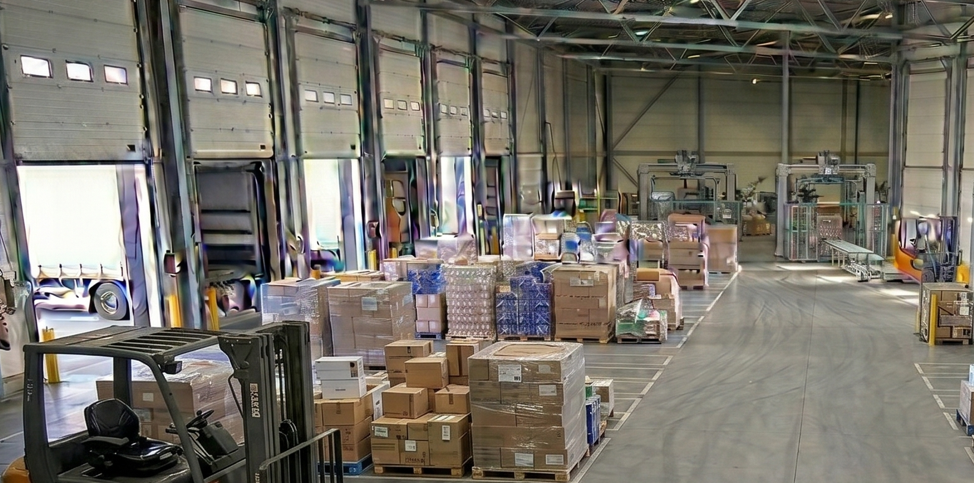
Distribution Center · Labor & Swim Lane Dashboard
| Swim Lane | Dock | Cycle Time |
|---|---|---|
| Lane 1 | Dock 2 | 30 min |
| Lane 2 | Dock 3 | 3 hr |
| Lane 3 | Dock 5 | 90 min |
| Lane 4 | Dock 6 | 45 min |
AGV Fleet · Idle Time & Response Dashboard
| Vehicle | % Time Idle | Idle Events | Avg Response |
|---|---|---|---|
| AGV-1 | 10% | 3 | 12m 30s |
| AGV-2 | 22% | 5 | 24m 15s |
| AGV-3 | 9% | 2 | 11m 00s |
| AGV-4 | 15% | 4 | 18m 45s |
Share of shift time stopped · last 7 days
% of shift time idle, fleet-wide · by week
Share of total idle time, fleet-wide · last 7 days

Leela Platform turns standard cameras into powerful data feeds that stand alone or supply context for your IoT sensors – versatile sensing of the what.
Leela Assistant works with you to navigate and analyze the data – to explain the why.
Click to see how Leela can work with you to improve Productivity and Safety



Leave your email and we'll reply within one business day.
Switch from partial or no data coming from some stations to capturing all the data you need from every station on your floor.

Set up in days! Leela AI delivers actionable insights to boost manufacturing productivity.