
Your Best Process Engineer Can’t Watch 400 Stations

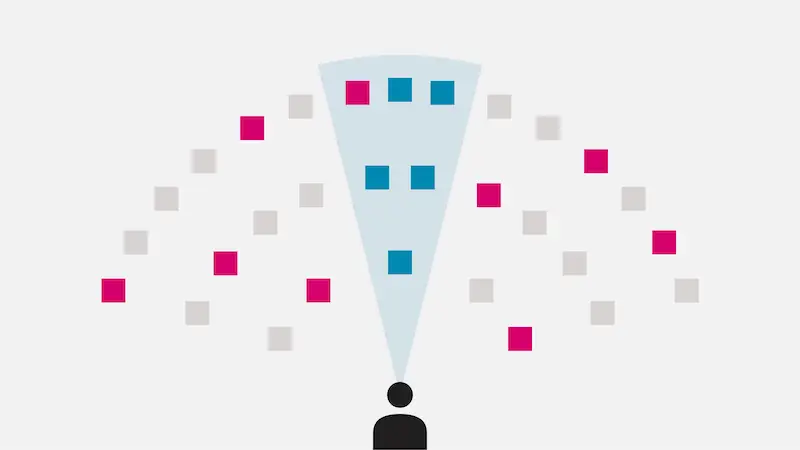
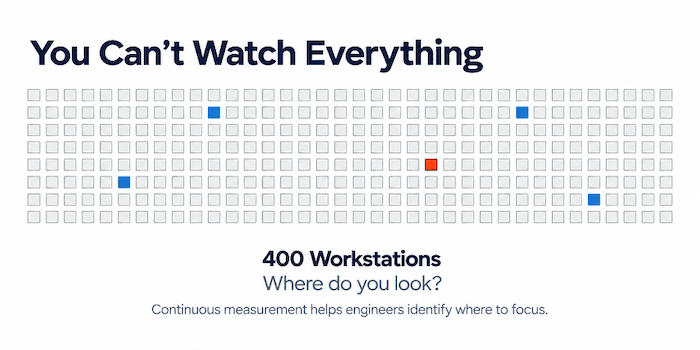
You may notice there are 288 boxes above and not 400, but that is beside the point. Your best process engineer can’t watch 400 stations or even 288 stations.
Manufacturing engineers spend a surprising amount of time trying to figure out what actually happens on the production floor.
A line misses its production target. A workstation’s cycle time increases. Operators spend more time waiting for materials. A process that ran smoothly last month suddenly struggles to keep up.
Somewhere in the facility, something changed.
The challenge is figuring out what, where, and why.
The Problem Isn’t Engineering Expertise. It’s Observation.
Consider a manufacturing facility with 400 workstations.
Even with an experienced industrial engineering team, continuously observing every workstation is impossible.
Engineers have to prioritize where they spend their time. They conduct time studies, walk the floor, interview operators, and review production reports.
These methods work. But they only capture a fraction of what happens across an entire facility.
An engineer might spend an afternoon investigating a suspected bottleneck at Station 12 while an entirely different issue develops at Station 37.
A material shortage might occur repeatedly during the night shift but never appear during daytime observations.
A workstation might slowly become less efficient over several weeks, without the change being large enough to attract anyone’s attention.
Engineers don’t lack the ability to identify these problems. They lack the time to observe everything.
What Happens When Observation Becomes Global and Continuous?
Imagine that the same engineering team could review activity measurements collected across hundreds of workstations.
Instead of deciding where to conduct a time study based primarily on reports and anecdotal observations, they could start by examining where performance has changed.
- Which stations experienced the largest increases in cycle time?
- Where is non-value-added activity accumulating?
- Which production cells spend the most time waiting?
- Where did a process change occur, and did performance improve afterward?
Visual intelligence makes this type of analysis possible by using cameras and AI to measure production activities over time.
Rather than requiring engineers to manually observe every cycle, systems like Leela AI can collect measurements of cycle times, operator activity, waiting, and other configured production events.
This doesn’t eliminate the need for time studies, engineering judgment, or direct observation. It changes where those resources are applied.
From Finding Problems to Solving Them
Consider a simple example.
A manufacturing engineer has time to investigate two production cells this week.
Traditionally, those priorities might be determined by supervisor reports, recent production misses, or observations from a plant walk-through.
With continuous activity measurements, the engineer can begin by comparing the cells.

Cell B clearly deserves a closer look, assuming the cells perform comparable work under similar conditions.
The engineer investigates and discovers that operators regularly leave their stations to retrieve components from a shared storage location.
The solution might be as simple as relocating materials closer to the point of use.
The important part isn’t that AI discovered a new engineering principle. It’s that the engineer navigated towards a problem worth investigating without first spending hours searching for it.
Give Engineers Better Visibility, Not More Dashboards
Manufacturers don’t necessarily need another dashboard containing hundreds of metrics.
They need to know where to focus.
The value of continuous visual intelligence isn’t simply the amount of data collected. It’s the ability to turn that data into specific questions and improvement opportunities.
Leela AI helps manufacturing teams measure production activities, compare performance across stations and cells, and investigate changes in operational performance. Leela AI works on your behalf to find examples of excellence and opportunities to improve, and notifies you with details of what needs your attention.
The goal isn’t to replace the engineer who understands the process. It’s to extend their visibility beyond the handful of workstations they can personally observe, and to have a automated filter to help automatically highlight what’s important.
Your best process engineer can’t watch 400 stations. But they shouldn’t have to.
See What Your Production Data Is Missing
Leela AI uses visual intelligence to measure production activity across manufacturing operations, helping engineers identify performance changes and prioritize improvement opportunities.
Learn more about the Leela AI Visual Intelligence Platform →