
The Complete Guide to Reducing Industrial Safety Risk with Visual Intelligence

Background
Most industrial plants already run a safety program: training, PPE policies, audits, and incident reporting. What most programs lack is a continuous view of what actually happens on the floor between audits. This guide explains how visual AI fills that gap, so teams can find and fix risks before they lead to injury.
If you have read our earlier guides on putting existing cameras to work and on shift benchmarking, the approach will feel familiar. Safety is one of the highest-value places to apply the same visual intelligence.
Get Ahead of Accidents
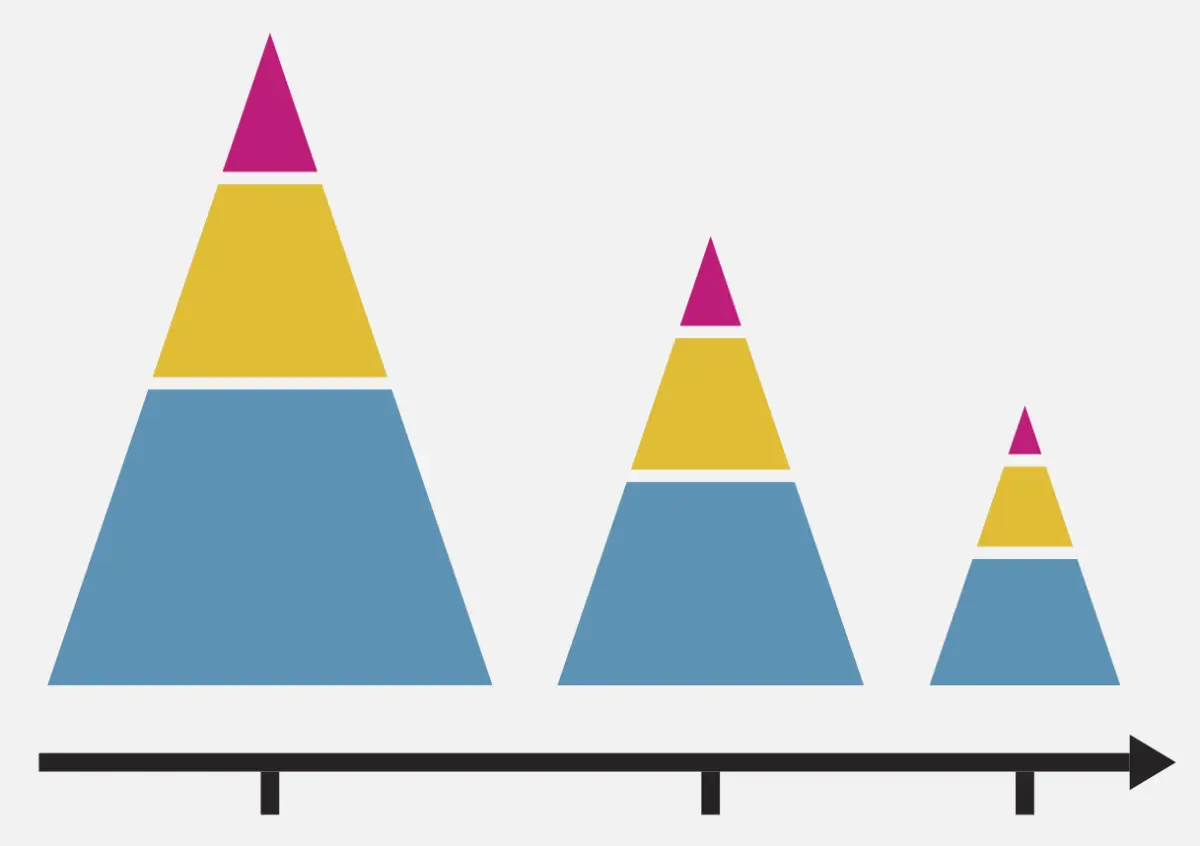
Most safety data is lagging. Injury reports, recordable rates, and insurance claims tell you something went wrong after someone was already hurt. The leading indicators, such as near misses and PPE lapses, are far more common, but they often go unseen or unreported.
A worker lifts a respirator for a few seconds while grinding continues nearby. Someone steps into a hazard zone to grab a tool while the zone is active. A lone worker on the night shift falls and no one is around to notice. None of these show up in an incident log until the day one of them turns into an injury.
Visual AI changes this by turning cameras into continuous safety sensors. It detects unsafe behaviors, missing or incorrect PPE, and critical events like a worker down, and reports them so teams can act. This guide walks you through what visual AI can detect, why context matters, how it fits into an existing safety program, a concrete example, and how to get started.
Key Takeaways: Reducing Industrial Safety Risk with Visual Intelligence
- Visual AI shifts safety from reactive response to proactive prevention by detecting near misses and PPE lapses, not just incidents.
- Context-aware PPE monitoring checks for the gear that current conditions require, so teams focus on true violations instead of unnecessary alerts.
- Hazard zone enforcement aligns PPE requirements with actual risk, tightening requirements only while a zone is active.
- Continuous worker-down detection covers lone workers, night shifts, and low-activity periods when no one else is watching.
- Software-defined sensors run as software on video feeds without reprogramming cameras, which makes them cost-effective and quick to deploy.
- Visual AI delivers the most value as a coaching tool that supports training, monitoring, and compliance, not as a disciplinary system.
Why Traditional Safety Methods Fall Short
Incident logs and injury rates measure outcomes after harm has occurred. They are essential for reporting, but they cannot tell you which behaviors are building toward the next incident.
Near-miss reporting depends on people noticing an event, recognizing it as a near miss, and choosing to report it. Many near misses last only seconds, and workers may worry that reporting one will get a colleague in trouble. The result is a near-miss log that captures a small fraction of what actually happens.
Safety walks and audits capture a snapshot. A safety manager walking the floor for an hour sees how people behave when a safety manager is present, not how they behave at 2 a.m. Large facilities also have areas that are simply hard to watch: remote corners, overnight maintenance, and lone workers on patrol or retrieving equipment.
Finally, many camera-based tools apply the same rule everywhere, all the time. Flagging every worker without a face shield, regardless of whether a hazard is present, produces a flood of alerts. Teams quickly learn to ignore them, and the real violations get lost in the noise.
What Is Visual Intelligence for Industrial Safety?
Visual AI for safety uses cameras and AI to detect unsafe conditions and behaviors on the production floor and report them as they happen. It typically covers three kinds of events: PPE violations, near misses and higher-risk activities, and critical events such as a worker down.
This differs from basic camera analytics, which flag objects in a frame. Industrial safety depends on context. Whether a face shield is required depends on where the worker is standing and what is happening around them, and a system that ignores that context either misses real risks or buries teams in false alarms.
The goal is not to watch people. It is to give safety and operations teams reliable, continuous data on where risk actually occurs, so they can coach, retrain, and fix the processes that put workers in harm’s way.
How Visual Intelligence Enables Proactive Safety
The most effective safety systems do more than spot a hard hat. They understand when and where a piece of gear matters, and they keep watching when no one else is.
Context-Aware PPE Monitoring
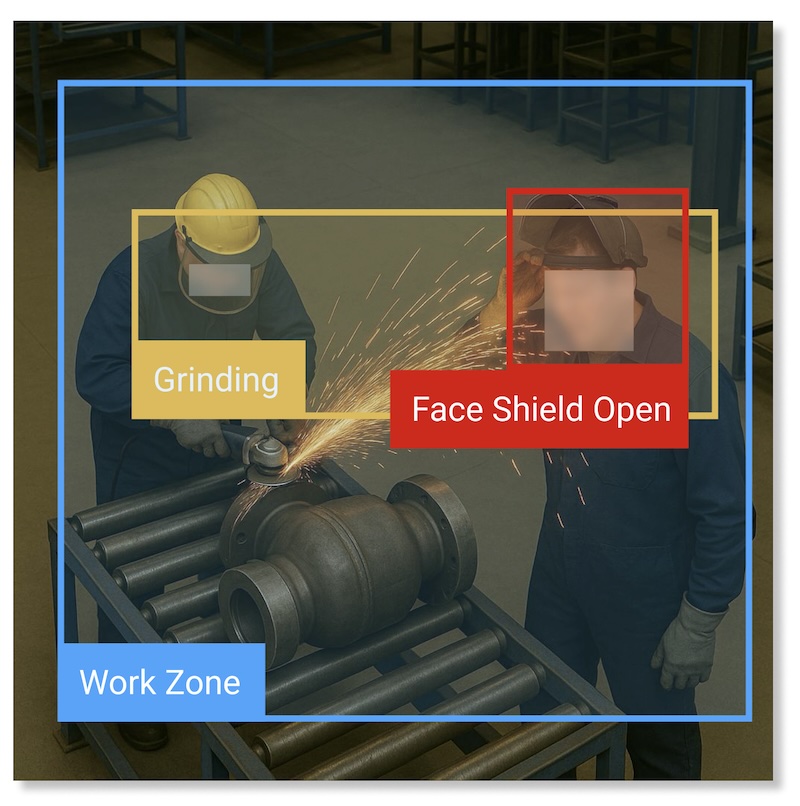
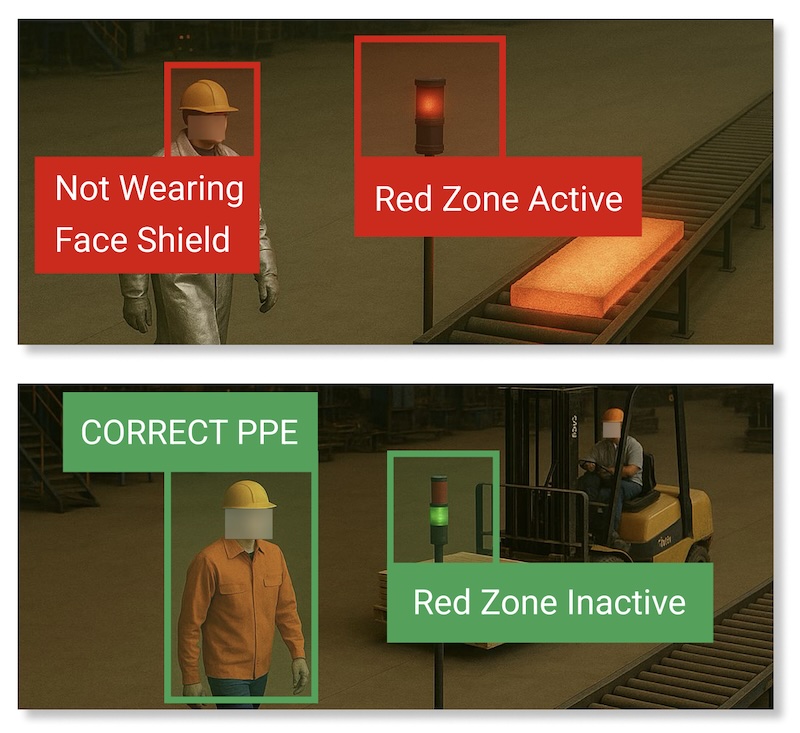
Context-aware monitoring recognizes defined work zones and detects active conditions, such as grinding with visible sparks or molten metal being poured. It then checks whether workers in those areas have the gear the moment requires: heat-resistant jackets, spats, hard hats, respirators, or face shields.
A raised mask is flagged only when the worker is inside the work zone and exposed to active grinding. The same raised mask during a break, or outside the zone, is not a violation. This keeps attention on true risks instead of unnecessary alerts.
Hazard Zone Enforcement
Many plants signal active hazards with a status light, such as a red light while a furnace is being loaded or a pour is underway. When the red light is on, visual AI checks for the specific gear required in that moment. When the light turns green, only basic facility-wide PPE is required.
This aligns PPE enforcement with actual risk, not just policy. It also produces a consistent record of every unprotected entry into an active zone, something no human observer can maintain across every shift.
Continuous Worker-Down Detection
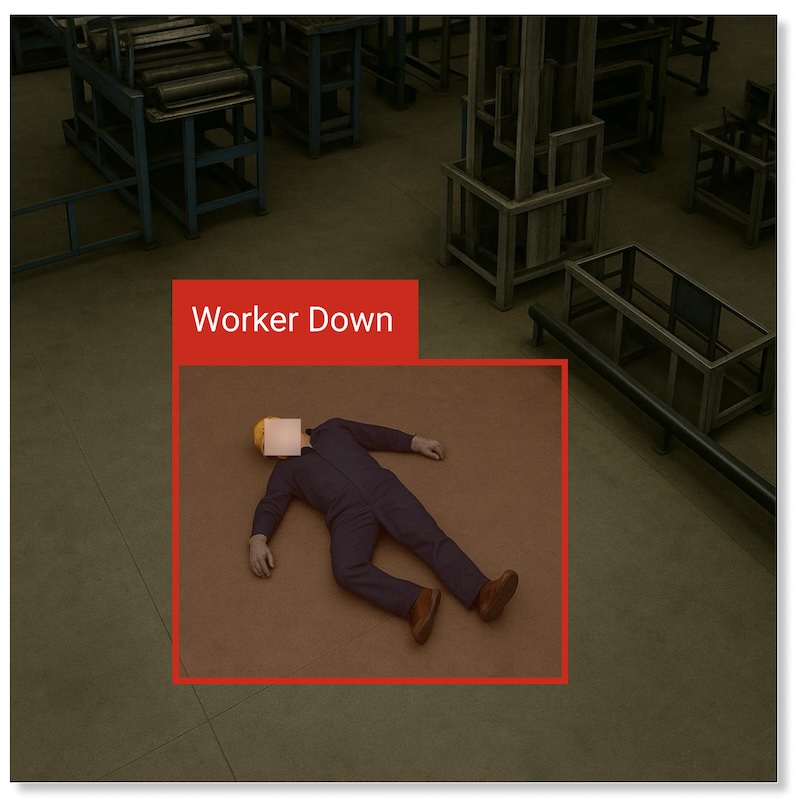
Visual AI can detect a worker who is down and alert the team immediately. In large facilities that stay active at night or during low-activity periods, this capability is essential. Whether it is a lone worker retrieving equipment or a security guard on patrol, no one in trouble goes unnoticed, and help arrives faster.
Near-Miss and Higher-Risk Activity Detection
Beyond PPE, visual AI can detect safety near misses and measure how often higher-risk activities occur, such as ladder use, lifting heavy objects, or placing hands into tools. Frequency data shows where risk concentrates, which areas need engineering controls, and which tasks need better training.
Software-Defined Sensors
Leela AI delivers these capabilities through software-defined sensors: AI agents in the Leela AI platform that extract safety data from video feeds. They do not reprogram the cameras. They run as efficient software processes, either on-premise or in the cloud. Much like the software-defined sensors we described in our article How Visual Intelligence Compares to IoT Sensors, the safety sensors scale extremely well because they are software, not hardware.
This makes them cost-effective and quick to deploy. It also makes them effective for areas of the plant that are otherwise hard to monitor, where adding people or dedicated hardware is impractical.
What to Measure for Proactive Safety
Focus on leading indicators that point to specific, fixable causes. A total violation count is a start, but it does not tell you whether the problem is one area, one shift, one task, or one piece of gear.
Track these metrics by area, shift, and time of day:
- PPE compliance rate, broken down by type of gear and the condition that requires it
- Near-miss counts on a daily, weekly, or monthly basis
- Unprotected entries into active hazard zones
- Frequency of higher-risk activities such as ladder use, heavy lifts, and hands placed into tools
- Recurring issues: the same violation, in the same place, at the same time
- Response time to critical events such as a worker down
The Leela AI Safety Dashboard displays a rolling violation count for the last 24 hours alongside a playlist of time-stamped video clips, one for each event. A safety manager can see, for example, that a clip at 13:56 shows a worker missing protective gloves, then open it to understand exactly what happened.
Reading the Trend: Expect Spikes
A healthy safety trend is rarely a smooth line. Over months, the rolling average is the number to watch.
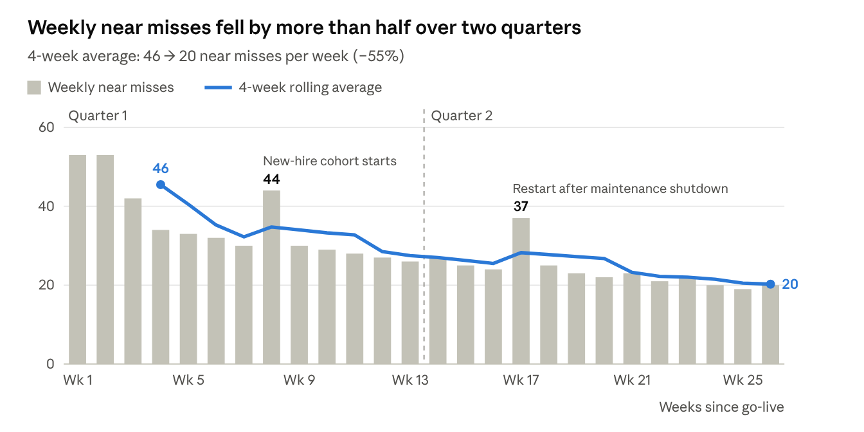
Simulated data for illustration · 26 weeks (two quarters) after go-live
Weekly counts jump when conditions change, such as a new-hire cohort or a restart after a maintenance shutdown. Those spikes are useful: they show where and when to focus coaching before the next change comes around.
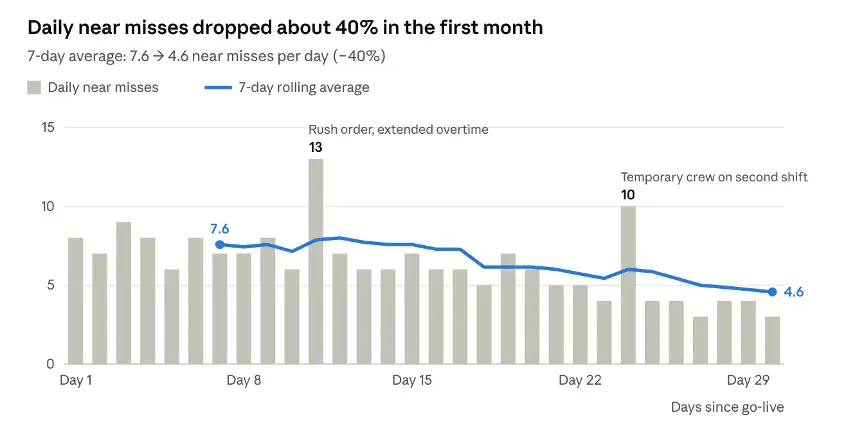
Simulated data for illustration · first 30 days after go-live
Daily data is noisier still. Judge progress by the 7-day average, and treat a single bad day, such as a rush order with extended overtime, as a prompt to review that day’s clips rather than a change in direction.
What Improvement Can Look Like
Results depend on your starting baseline, the risks you target, and how consistently teams act on the data. The ranges below are illustrative examples of what a focused program can achieve.
Capability | Benefit | Example result |
|---|---|---|
Near-miss detection | Fewer accidents and less downtime | 30–50% fewer incidents |
Near-miss detection | Lower workers’ compensation premiums | 10–30% insurance savings |
PPE violation detection | Higher adherence without added oversight | PPE compliance sustained above 95% |
PPE violation detection | Fewer penalties and lower insurance costs | $100K/year savings on fines and insurance |
Hazard zone enforcement | Consistent tracking of zone access | 60–90% fewer unprotected zone entries |
Hazard zone enforcement | Less need for constant oversight | Staff hours shifted from monitoring to coaching |
How Visual Intelligence Fits Into Your Safety Program
Visual AI does not replace a safety program. It strengthens the three activities that every program already depends on: training, monitoring, and compliance.
Training
- Quickly scrub video for clips and incidents that can be used in training materials
- Share weekly highlight reels of near misses and accidents with team members
- Build more relevant training based on how often higher-risk activities actually occur
- Measure the impact of training programs on behavior around the facility
Monitoring
- Detect safety near misses as they happen using an agent that can notify you of safety events.
- Use an near miss event list on the dashboard to review recordings of all the safety events.
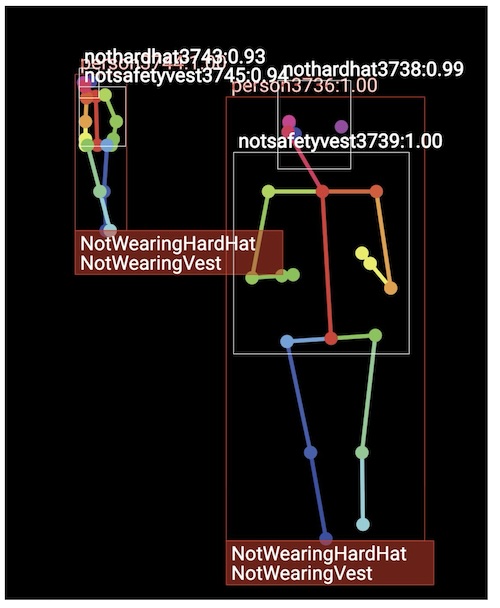
- Detect PPE violations, including vests, masks, gloves, hearing protection, and hard hats
- Add live shop-floor safety scoreboards with automated daily, weekly, or monthly counts of near misses and incidents
- Measure the frequency of higher-risk activities such as ladder use, lifting heavy objects, and placing hands into tools
Compliance
- Have weekly review meetings with the team and look at the actual near-misses on video to help drive home the risks of non-compliance.
- Track adherence to safety standards and procedures with objective statistics
- Help managers confirm that compliance is maintained and not slipping over time
- Highlight recurring issues that require corrective action
- Support audits with verifiable data on PPE usage, incidents, and near misses
Getting the Data to the Right People
Safety data is only useful if it reaches the people who can act on it. Leela AI delivers it through real-time notifications from its AI agent, automated reports, floor kiosks and dashboards, and APIs that connect to MES, ERP, WMS, and BI systems.
A Concrete Example: Closing a Hidden PPE Gap
The Problem
Consider a mid-size metal products manufacturer running three shifts. Safety walks consistently report near-full PPE compliance, yet minor burns and eye injuries keep appearing in the first-aid log. The safety manager suspects that short lapses are happening when no one is watching, but has no way to confirm it.
An earlier trial of basic camera analytics did not help. It flagged every worker without a face shield anywhere in the building. Within days the team was receiving so many alerts that they stopped reviewing them.
The Solution
The safety manager and the plant’s operations leader deploy software-defined sensors on cameras covering the grinding booths, a furnace loading area, and the overnight maintenance area. The sensors check for respirators and face shields only when grinding sparks are visible and a worker is inside the work zone. They check for heat-resistant jackets and spats only when the furnace area’s status light is red. Worker-down detection runs continuously.
Face and body blurring are active from day one. Before going live, plant leadership walks the floor to explain the system’s purpose: coaching and process improvement, not discipline.
After three weeks of data collection, the dashboard reveals a clear pattern. Most violations come from two situations: workers raising respirators to inspect their work while grinding continues in the next booth, and brief entries into the furnace area to retrieve tools while the light is red. Both last only seconds, which is why safety walks never caught them.
The Impact
The team makes two process changes. They add a tool staging rack outside the furnace area, so workers no longer need to step in while it is active. They also adjust the grinding booth layout and add a short inspection step after grinding stops. Blurred clips from the event playlist become part of weekly toolbox talks.
Four weeks after the changes, unprotected entries into the active furnace area fall by roughly 70%, and PPE compliance in the grinding area holds above 95%. Alerts are now rare enough that every one gets reviewed. The safety manager uses the ongoing data to confirm that the gains hold and to choose the next area to improve.
Who Is Involved
This type of initiative typically involves three groups. The safety leader (EHS manager, safety manager, or safety director) owns the program, defines the zones and PPE rules, reviews events, and leads coaching. The operations leader (plant manager, VP of Operations, or production director) owns the business case, approves the pilot, and funds the physical and process changes the data points to.
Frontline supervisors and team members are the third group, and the most important. They use the clips in toolbox talks, flag rules that do not match how the work is actually done, and suggest the fixes that make the safe way the easy way.
All three need decision-ready information that connects specific behaviors to specific locations, times, and conditions. Without that data, safety conversations rely on anecdotes and stay reactive.
How to Start Using Visual AI for Safety
Step 1: Define the Risks You Want to Reduce
Start with a specific question. “Are workers wearing face protection while grinding is active?” is better than “improve safety.” Tie the question to an outcome that matters to the business: fewer first-aid cases, lower workers’ compensation costs, or stronger audit readiness.
Step 2: Select a Pilot Area
Choose an area with known hazards where compliance is hard to verify. High-risk processes, areas that are difficult to observe, and night or weekend operations are good candidates. Start with a few cameras and expand once the approach is proven; there is no need to cover the whole facility on day one.
Step 3: Map the Context
For each pilot area, define the work zones, the conditions that create risk (sparks, a pour, an active status light), and the gear each condition requires. This step is what separates context-aware monitoring from a flood of alerts. Involve the supervisors who know the work, since they will spot rules that do not match reality.
Step 4: Engage Your Frontline Team
Frontline concerns about cameras can derail an implementation that otherwise makes sense. Address privacy upfront by showing that face and body blurring is active, and explain that the system exists to find risky conditions and coach, not to punish individuals. Share your organization’s ethical principles for AI, or point to a vendor’s published principles, such as Leela AI’s.
Step 5: Collect, Review, and Coach
Let the system gather data for at least two to three weeks before drawing conclusions. Then review it on a regular cadence, weekly is a good starting point, and assign action items: a coaching conversation, a training update, or a change to staging or layout. Measure again to confirm the change worked.
Common Pitfalls in Visual AI Safety Programs
Using the data for discipline instead of coaching is the most damaging mistake. Plants that sustain high PPE compliance tend to treat each event as a coaching opportunity. When workers see the system as a way to catch them, trust erodes and the program stalls.
Alerting on everything is a close second. Context-blind rules generate so many notifications that teams stop reading them, which is worse than having no alerts at all. Configure detection around real risk, and expand the rules only when each alert is consistently worth acting on.
Treating every violation as a people problem misses the root cause. If workers keep stepping into an active zone, ask why: perhaps the tools they need are staged inside it. The best fixes often change the process so the safe choice is also the easiest one.
Finally, collecting data without acting on it creates no value. Establish a regular review cadence where safety and operations leaders discuss the latest data, assign owners, and follow up.
Beyond Safety: The Same Cameras Support Productivity and Quality
The cameras and software-defined sensors that track safety can also measure how work gets done. Many plants start with safety and then extend the same platform to operations.
On the productivity side, visual AI can measure staffing in each work area, cycle times and labor inputs, and the split between value-added, non-value-added, and necessary but non-value-added work. It can also compare productivity across shifts and locations, validate process changes with before-and-after data, identify bottleneck and pacemaker processes, and track work in progress.
On the quality side, it can detect non-adherence to standard work, skipped or out-of-sequence tasks, and too little time spent on a task. These are the same kinds of process deviations that often sit behind safety incidents. For a deeper look at the productivity use case, see our guide, The Complete Guide to Shift Benchmarking with Visual AI.
In Conclusion: Visual AI Turns Safety from Reactive to Proactive
Safety leaders face a visibility gap between what incident reports capture and what actually happens on the floor. Visual AI closes that gap by detecting the near misses, PPE lapses, and critical events that traditional methods miss.
Context is what makes the data useful. When detection understands which conditions create risk and which gear each condition requires, alerts point to real problems, and teams can spend their time coaching instead of filtering noise.
Leela AI’s software-defined sensors bring that context-aware visibility to the areas that are hardest to watch, with privacy protections in place from day one. If you can see where risk happens, you can get ahead of it.
FAQs about Visual AI for Industrial Safety
What is visual intelligence for industrial safety?
Visual AI for industrial safety uses cameras and AI to detect PPE violations, near misses, higher-risk activities, and critical events such as a worker down. It reports these events so safety teams can coach, retrain, and fix processes before an incident occurs.
What is functional safety and how is it related?
Functional safety systems are those that directly control power, machines and automation without human intervention. One example is a pressure pad that shuts off a machine when someone steps on it, preventing injury. Visual AI systems are not yet ready to become functional safety systems. They can work closely with the functional safety tools to better understand what people are doing before then trigger such a system, and help guide the safety team to better design their systems to reduce unnecessary emergency stops or determine the root cause of a functional safety system not working properly.
How is context-aware PPE monitoring different from standard PPE detection?
Standard PPE detection checks whether gear is present, everywhere, all the time. Context-aware monitoring checks whether the right gear is present for current conditions, such as active grinding or an active hazard zone. This catches the violations that matter and avoids the alert fatigue that causes teams to ignore notifications.
What is a software-defined sensor?
A software-defined sensor is an AI agent that extracts specific safety data from a video feed. Leela AI’s software-defined sensors do not reprogram the cameras; they run as efficient software processes, on-premise or in the cloud. This makes them cost-effective and quick to deploy.
Does visual intelligence replace safety walks and safety managers?
No. Visual AI gives safety professionals continuous data they could never collect by hand, so they can spend less time monitoring and more time coaching. Safety walks remain valuable for conversations, engineering assessments, and building culture. Safety walks can now be coordinated with patterns of compliance falloff to make them even more effective.
How does visual intelligence protect worker privacy?
Look for a platform that blurs faces and bodies, is designed to track risky conditions rather than rate individuals, and complies with privacy regulations. Leela AI complies with the EU GDPR, the California Consumer Privacy Act (CCPA), and the Illinois Biometric Information Privacy Act (BIPA). It also holds a SOC 2 attestation and publishes its ethical principles.
Can safety data integrate with existing systems?
Yes. Leela AI delivers safety data through real-time notifications, automated reports, and floor kiosks and dashboards. It also integrates via API with MES, ERP, WMS, and BI systems, so safety data can be analyzed alongside production and quality data.