An easy-to-use manufacturing Operations dashboard for monitoring and analyzing
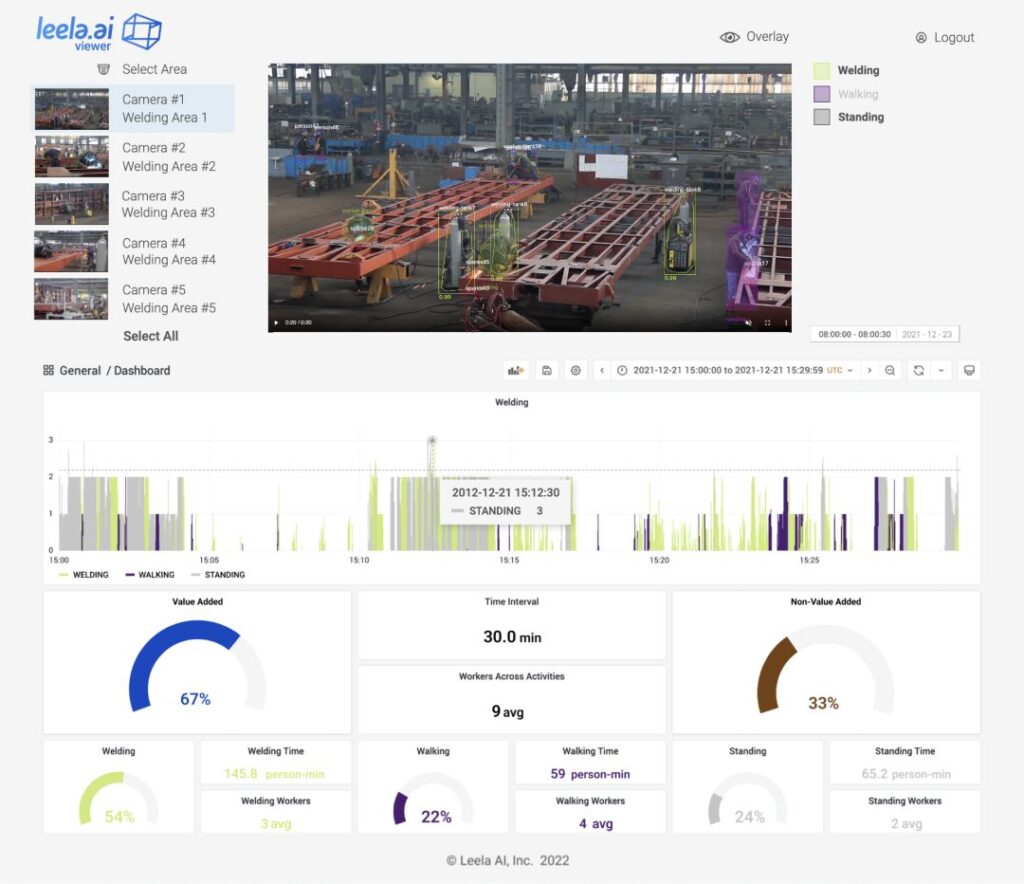
The Leela Viewer smart manufacturing operations dashboard is the customer interface to our real-time production monitoring system and visual AI platform. Leela Viewer generates real-time graphics of manufacturing activity metrics based on customer-defined events, enabling deeper insights for root cause analysis.
The KPI dashboard displays time-coded video with labeled object overlays and VCR controls. Our smart manufacturing software supplies web and mobile-based views of customized alerts and displays multiple timelines for easy comparison and analysis.
Analysis and Insights
Continuously identifies trends and measures impact of changes
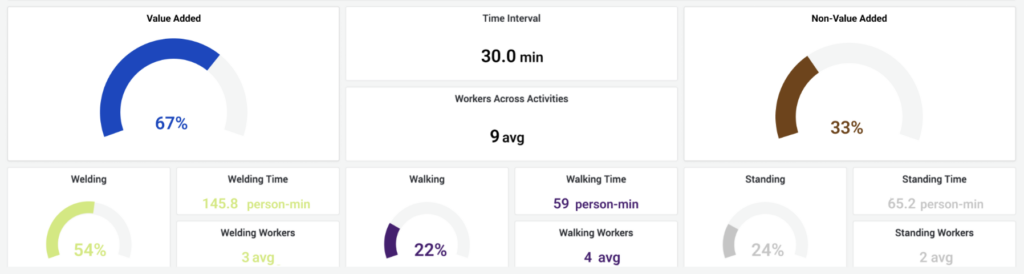
Reports insights into metrics like cycle time and value vs. non-value added activities
Provides options for blurring faces or bodies or disabling video storage and review
Measures and reveals continuous time and motion study data
Compares productivity between sites, shifts, and time periods
Enables user customization via drag and drop identification of new activities
Leela's Visual AI Platform & Smart Manufacturing Software
Visual Intelligence Software for Manufacturing
Camera Selector
Switch between camera views and drill down for dashboard insights into each view.
Legend
Track the detection of activities as each video segment is played.
Time Segment Selector
Zoom to specific time segments to see shifts, days, hours, or minutes.
Time Series Chart
View detection of activities over time. Click to play corresponding video.
Video Segment Playback
Scrub through video to locate sequences and click to advance to neighboring segments.
Analysis and Insights
See cycle time, throughput, value-add vs. non-value add activity and more. Compare trends over shifts and sites. View actionable alerts generated in real-time.
Want more information on how Leela Viewer can provide real-time manufacturing insights?